Color Palettes: Okabe-Ito and More, Click to Copy

color
visualization
Okabe-Ito, Paul Tol, viridis and other palettes as swatches. Click a color to copy its code, or copy a whole palette for R, Python, or CSS.
Published

2026-11-07

Modified

2026-11-07

Every time I pick colors for a figure, I end up looking up palette codes again. So I gathered the palettes I use most as swatches on one page. Click a color to copy it.

How to use

  • Click a swatch to copy that color’s code to the clipboard.
  • Use the switch below to choose HEX, RGB, or HSL. Your choice is remembered for next time.
  • “Copy all” under each palette copies the whole palette for R (c(...)), Python (a list), CSS (custom properties), or JSON.

The examples below use only base R graphics, with no extra packages.

Palettes designed for color vision diversity

People perceive color differently. Palettes that rely on hue alone, such as red versus green or blue versus purple, can be hard to tell apart for some readers. The palettes below were designed with that in mind. For simulating how they look, see Simulating Color Vision Deficiency in R.

Okabe-Ito

An eight-color palette proposed by Masataka Okabe and Kei Ito (Okabe and Ito 2008). It was also introduced in a Nature Methods column (Wong 2011) and is common in journal figures. In R, palette.colors(palette = "Okabe-Ito") returns it (R 4.0 or later) (R Core Team, n.d.).1 Note that R’s built-in version has nine colors: a gray (#999999) is added at the end.2 The leading black is handy for elements that should not depend on hue, such as lines and text.

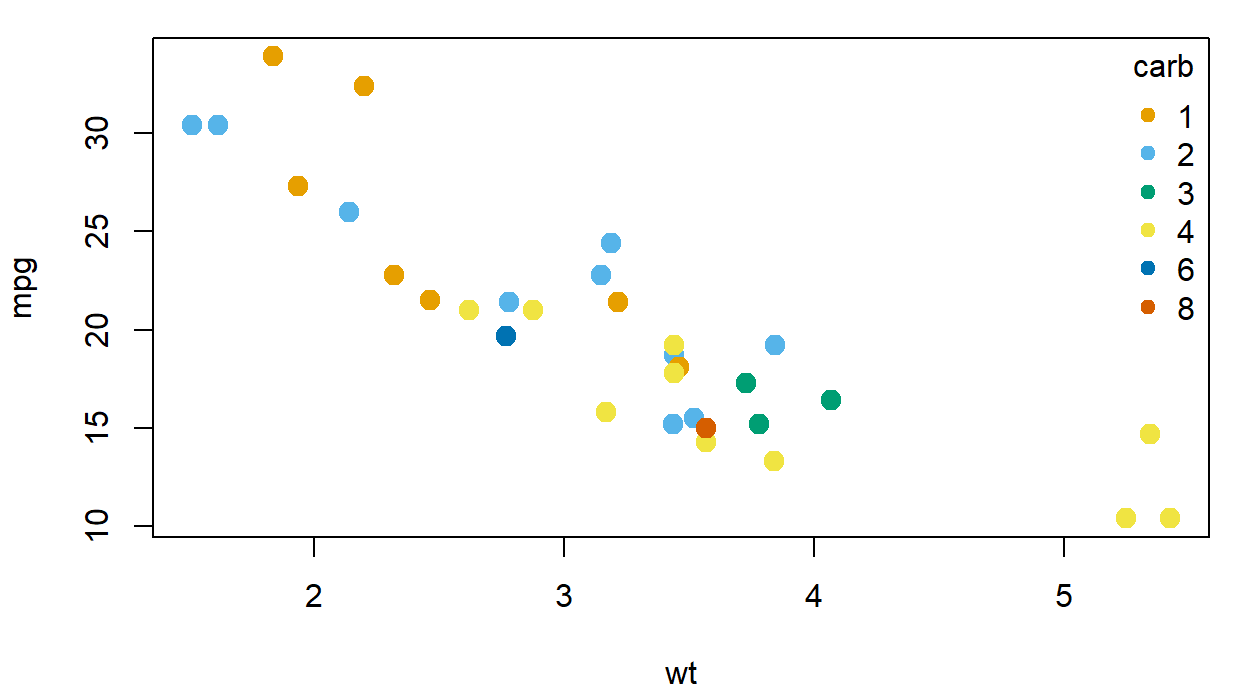
As an example, here is a scatter plot of weight against fuel economy in mtcars, colored by the number of carburetors (carb). It takes the seven colors of R’s built-in version that remain after dropping black and gray.

# 9 colors: black, 7 chromatic colors, gray. Keep the 7 chromatic ones.
okabe_ito <- unname(palette.colors(palette = "Okabe-Ito"))[2:8]
carb <- factor(mtcars$carb)

par(mar = c(4, 4, 1, 1))
plot(mtcars$wt, mtcars$mpg, col = okabe_ito[carb], pch = 19, cex = 1.4,
     xlab = "wt", ylab = "mpg")
legend("topright", legend = levels(carb), title = "carb", pch = 19,
       col = okabe_ito[seq_len(nlevels(carb))], bty = "n")

Scatter plot of car weight against fuel economy, colored by number of carburetors with the Okabe-Ito palette.

Paul Tol: Bright

One of the schemes compiled by Paul Tol, an instrument scientist at SRON, the Netherlands Institute for Space Research. Bright, Vibrant, and Muted all appear in his color-scheme document, which SRON published as a technical note rather than a journal paper (Tol 2021). It has seven colors with a calmer look than Okabe-Ito.

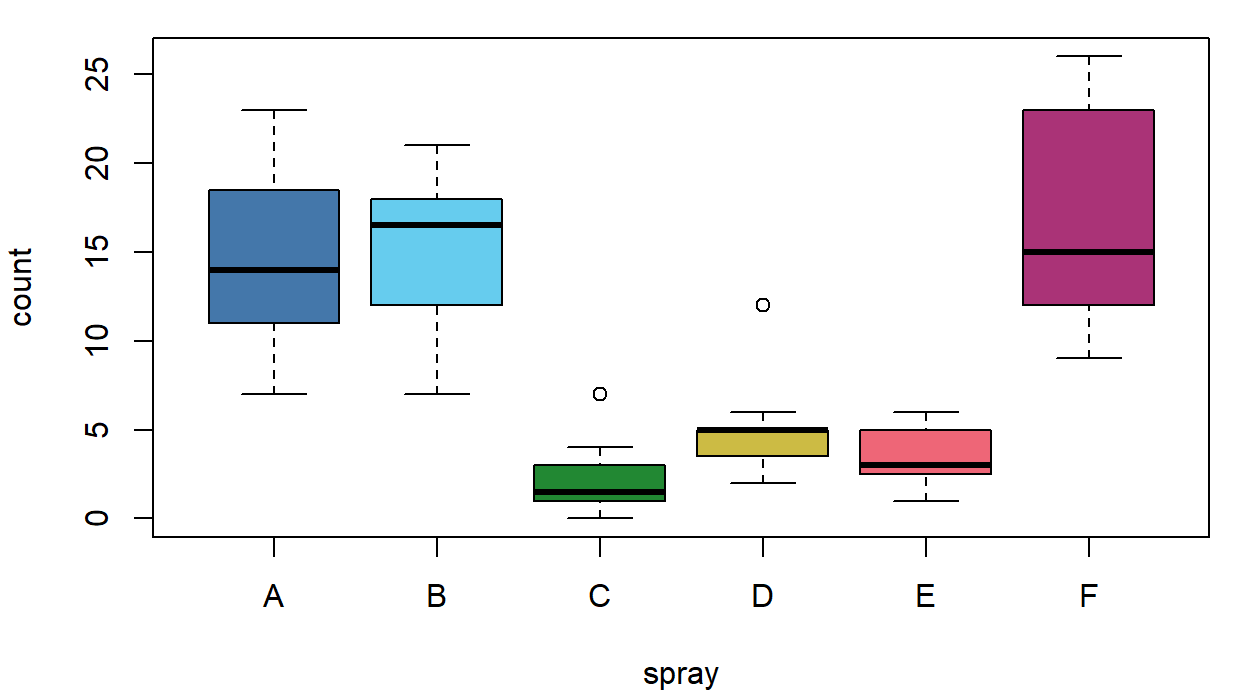
As an example, here is a box plot of insect counts by insecticide type (spray) from InsectSprays.

tol_bright <- c("#4477AA", "#66CCEE", "#228833", "#CCBB44",
                "#EE6677", "#AA3377", "#BBBBBB")

par(mar = c(4, 4, 1, 1))
boxplot(count ~ spray, data = InsectSprays, col = tol_bright)

Box plots of insect counts for six insecticides, filled with the Tol Bright palette.

Paul Tol: Vibrant

More saturated than Bright, and it includes orange. It stands out on both light and dark backgrounds.

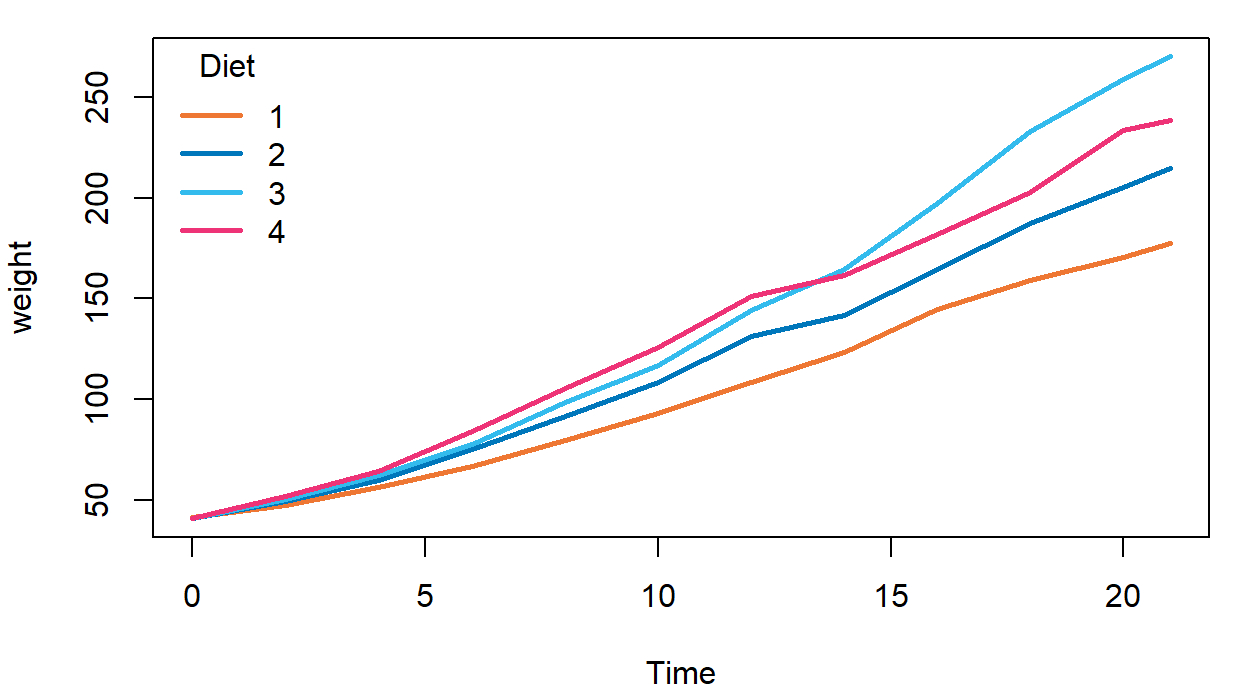
As an example, here is a line chart of mean chick weight by diet.

tol_vibrant <- c("#EE7733", "#0077BB", "#33BBEE", "#EE3377",
                 "#CC3311", "#009988", "#BBBBBB")

# mean weight at each Time (rows) for each Diet (columns)
m <- with(ChickWeight, tapply(weight, list(Time, Diet), mean))
cols <- tol_vibrant[seq_len(ncol(m))]

par(mar = c(4, 4, 1, 1))
matplot(as.numeric(rownames(m)), m, type = "l", lty = 1, lwd = 2.5,
        col = cols, xlab = "Time", ylab = "weight")
legend("topleft", legend = colnames(m), title = "Diet",
       col = cols, lty = 1, lwd = 2.5, bty = "n")

Line chart of mean chick weight over time for four diets, drawn with the Tol Vibrant palette.

Paul Tol: Muted

For when you need up to ten colors. The lower saturation keeps a crowded plot from looking noisy, at the cost of smaller differences between neighbors. The pale grey at the end suits missing values or an “other” category.

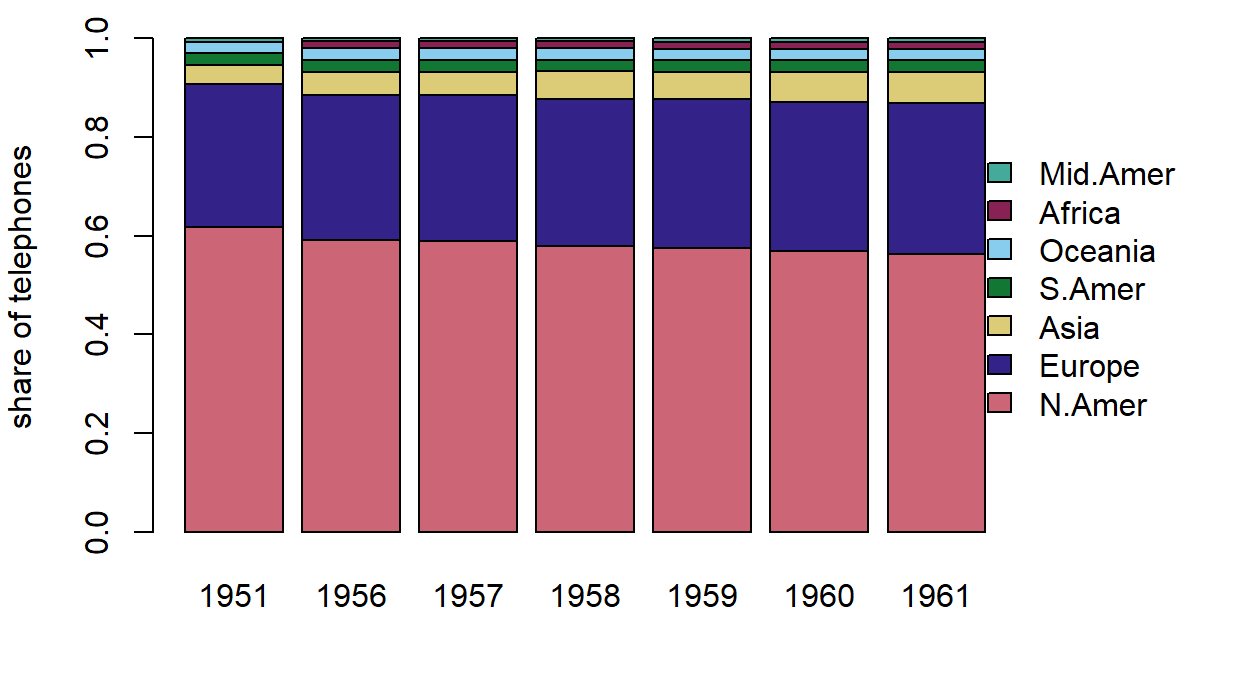
As an example, here is a stacked bar chart of each region’s share of telephones worldwide (WorldPhones) by year. There are seven regions, so it uses seven of Muted’s ten colors.

tol_muted <- c("#CC6677", "#332288", "#DDCC77", "#117733", "#88CCEE",
               "#882255", "#44AA99", "#999933", "#AA4499", "#DDDDDD")

# rows: regions, columns: years, each column sums to 1
share <- t(prop.table(WorldPhones, margin = 1))

par(mar = c(4, 4, 1, 6), xpd = TRUE) # xpd lets the legend sit in the margin
barplot(share, col = tol_muted[seq_len(nrow(share))],
        ylab = "share of telephones", legend.text = rownames(share),
        args.legend = list(x = "right", inset = c(-0.2, 0), bty = "n"))

Stacked bar chart of each world region's share of telephones for seven years, using the Tol Muted palette.

A palette for continuous values

viridis

Stéfan van der Walt and Nathaniel Smith designed it to replace jet, Matplotlib’s former default colormap (Smith and van der Walt 2015). It was presented in a SciPy 2015 talk rather than a paper. It became Matplotlib’s default in 2.0, and R users can get it from the viridis package (Garnier et al. 2024). It was later discussed in the literature too. A PLOS ONE paper by Nuñez and colleagues describes viridis as the current “gold standard” colormap (Nuñez et al. 2018). The paper proposes cividis, a colormap derived from viridis and further optimized for color vision deficiency. It also notes that viridis is optimal for viewers with normal color vision, rather than being optimized specifically for color vision deficiency.

Lightness changes monotonically from low to high values, which suits heatmaps and other figures that encode magnitude as color. Eight steps are shown here. The ribbon above them blends the eight colors smoothly.

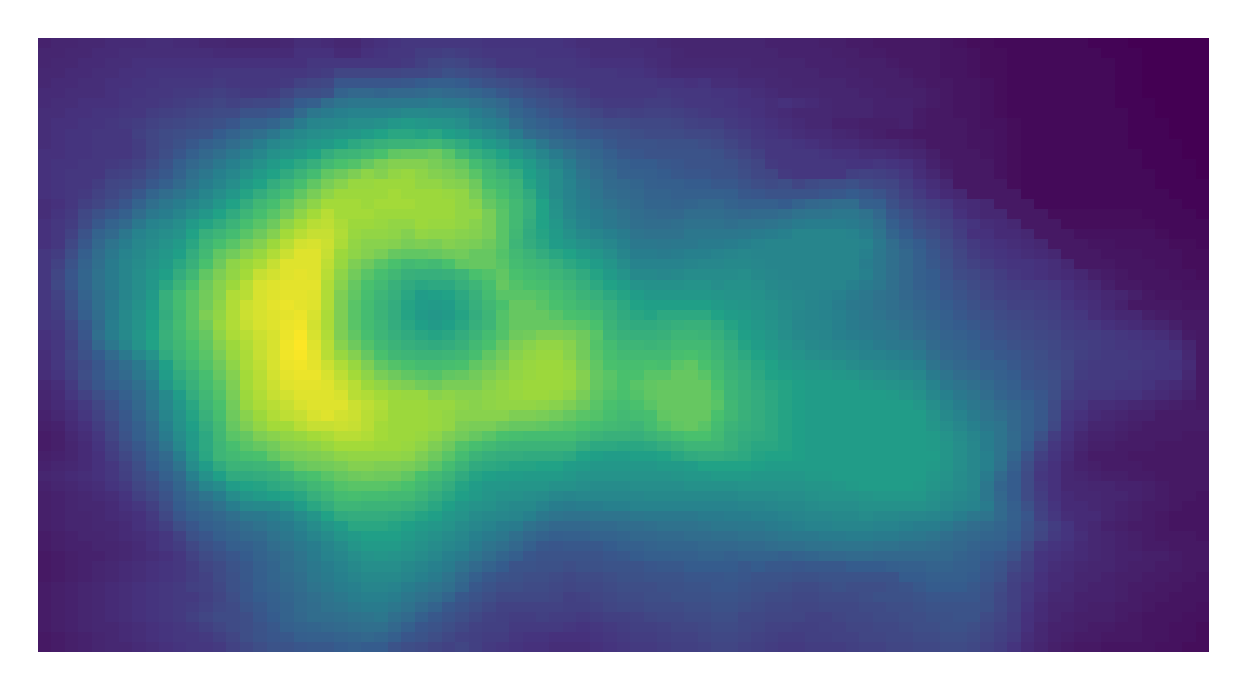
As an example, here is a heat map of a volcano’s elevation data (volcano). The eight colors are interpolated to 256. Base R’s hcl.colors(256, "viridis") gives a similar look, though its color values differ slightly.

viridis_8 <- c("#440154", "#46337E", "#365C8D", "#277F8E",
               "#1FA187", "#4AC16D", "#9FDA3A", "#FDE725")

# interpolate the 8 colors to 256 steps
pal <- colorRampPalette(viridis_8, space = "Lab")(256)

par(mar = c(1, 1, 1, 1))
image(volcano, col = pal, axes = FALSE)

Heat map of a volcano's elevation, colored with viridis.

Other familiar palettes

These were not made for color vision diversity. If you use them, combine color with line types, markers, or labels.

Tableau 10

Tableau’s default categorical palette, redesigned for Tableau 10 in 2016 (Stone 2016). It is familiar from dashboards and has ten colors. R also ships it as palette.colors(palette = "Tableau 10") (R Core Team, n.d.). It is not R’s default palette, though. Since R 4.0, the default is a different palette called "R4"; “Tableau 10” is one of the built-in palettes you can choose.

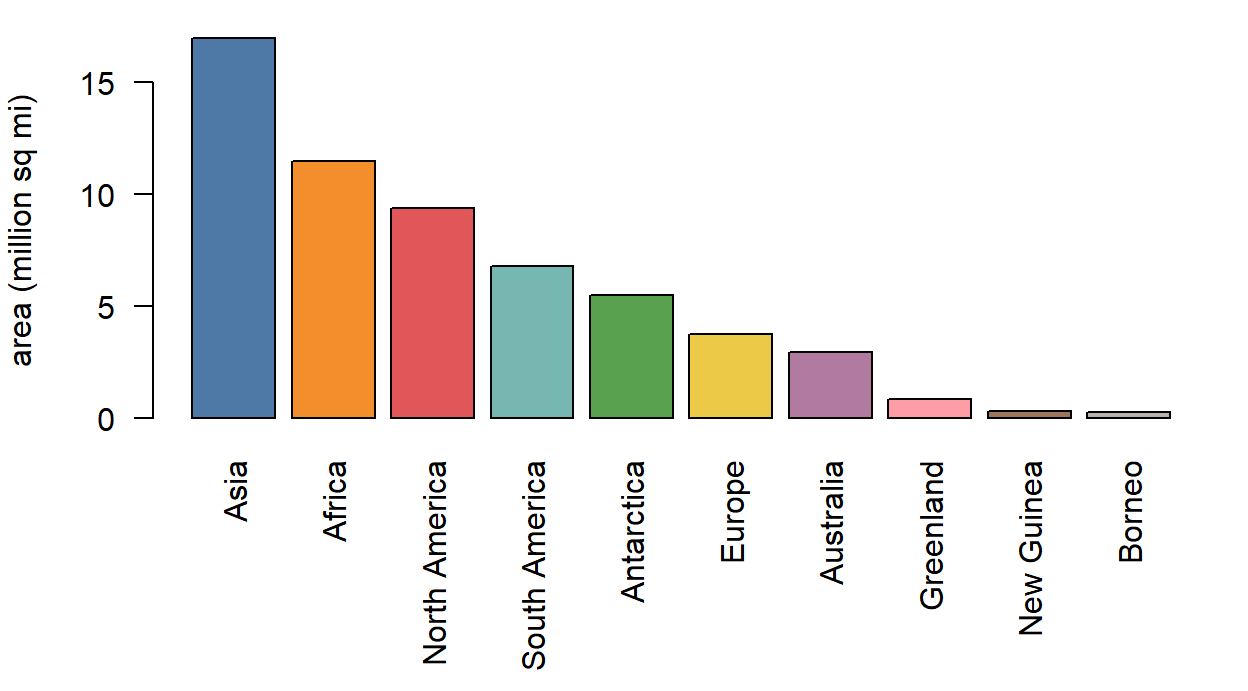
As an example, here is a bar chart of the ten largest of the world’s major landmasses (islands). Each bar takes one of the ten Tableau 10 colors built into R.

tableau10 <- unname(palette.colors(palette = "Tableau 10"))
top10 <- sort(islands, decreasing = TRUE)[1:10]

par(mar = c(7, 4, 1, 1)) # leave room for the labels
barplot(top10 / 1000, col = tableau10, las = 2, ylab = "area (million sq mi)")

Bar chart of the areas of the ten largest landmasses, each bar in a different Tableau 10 color.

Flexoki (this site’s palette)

This site’s background and other colors are based on Flexoki, a color system by Steph Ango. Its accent colors come in 600 for light backgrounds and 400 for dark ones.

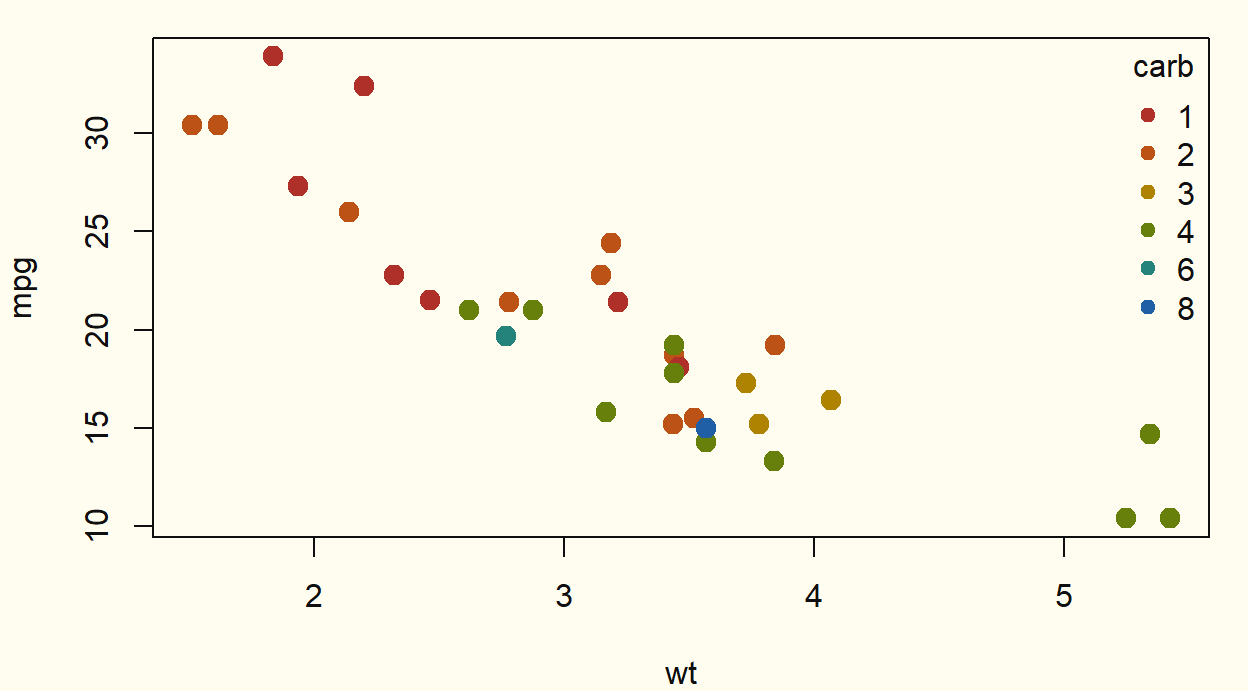
As an example, here is the same scatter plot as in the Okabe-Ito example, using the 600 accents on Flexoki’s paper color (#FFFCF0).

flexoki_600 <- c("#AF3029", "#BC5215", "#AD8301", "#66800B",
                 "#24837B", "#205EA6", "#5E409D", "#A02F6F")
carb <- factor(mtcars$carb)

# background (bg), axis lines and text (fg) colors
op <- par(mar = c(4, 4, 1, 1), bg = "#FFFCF0", fg = "#100F0F",
          col.axis = "#100F0F", col.lab = "#100F0F")
plot(mtcars$wt, mtcars$mpg, col = flexoki_600[carb], pch = 19, cex = 1.4,
     xlab = "wt", ylab = "mpg")
legend("topright", legend = levels(carb), title = "carb", pch = 19,
       col = flexoki_600[seq_len(nlevels(carb))], bty = "n", text.col = "#100F0F")

Scatter plot of car weight against fuel economy, colored by number of carburetors with Flexoki 600 accents on a cream background.

par(op) # restore the previous settings

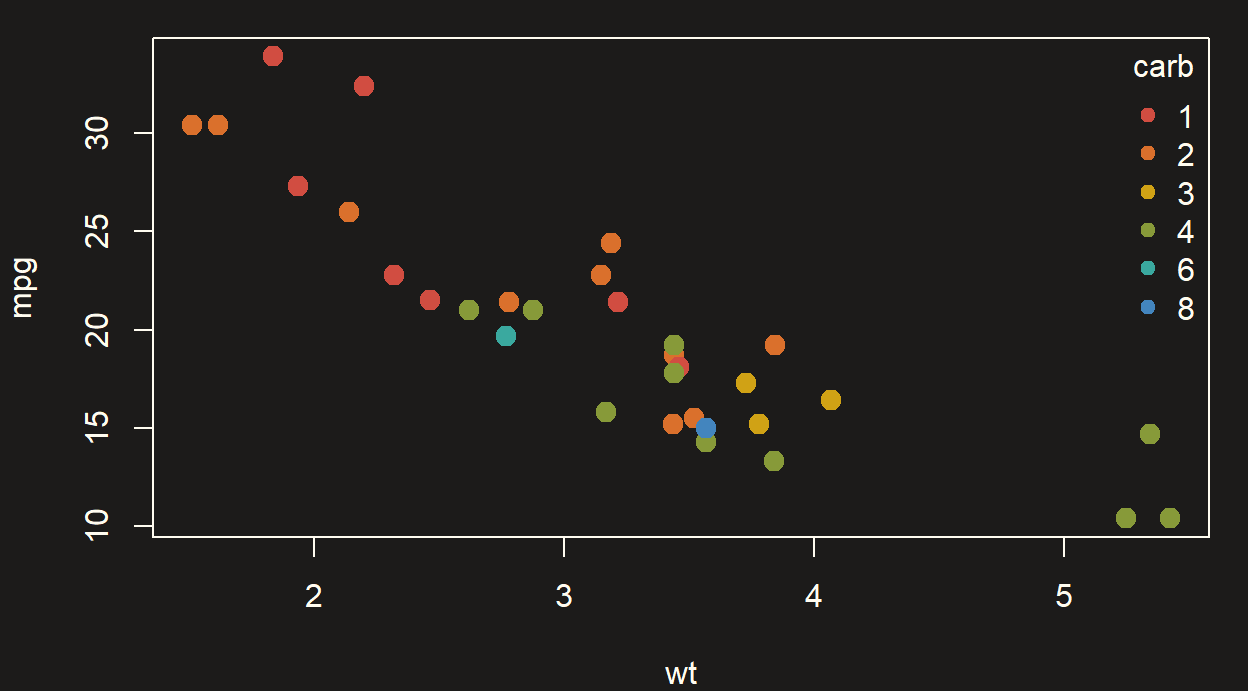
As an example, here is the same scatter plot with the 400 accents on a dark background (#1C1B1A).

flexoki_400 <- c("#D14D41", "#DA702C", "#D0A215", "#879A39",
                 "#3AA99F", "#4385BE", "#8B7EC8", "#CE5D97")
carb <- factor(mtcars$carb)

op <- par(mar = c(4, 4, 1, 1), bg = "#1C1B1A", fg = "#FFFCF0",
          col.axis = "#FFFCF0", col.lab = "#FFFCF0")
plot(mtcars$wt, mtcars$mpg, col = flexoki_400[carb], pch = 19, cex = 1.4,
     xlab = "wt", ylab = "mpg")
legend("topright", legend = levels(carb), title = "carb", pch = 19,
       col = flexoki_400[seq_len(nlevels(carb))], bty = "n", text.col = "#FFFCF0")

Scatter plot of car weight against fuel economy, colored by number of carburetors with Flexoki 400 accents on a dark background.

par(op)

Using them in code

R

The vector from “Copy all” → R can be set with palette(), after which it works for plots that specify colors by number or factor.

okabe_ito <- c("#E69F00", "#56B4E9", "#009E73", "#F0E442",
               "#0072B2", "#D55E00", "#CC79A7")

palette(okabe_ito) # set as R's current palette
plot(mtcars$wt, mtcars$mpg, col = factor(mtcars$carb), pch = 19)
palette("default") # restore the default

Python

The list from Python can be set as Matplotlib’s color cycle.

import matplotlib.pyplot as plt

okabe_ito = ["#E69F00", "#56B4E9", "#009E73", "#F0E442",
             "#0072B2", "#D55E00", "#CC79A7"]
plt.rcParams["axes.prop_cycle"] = plt.cycler(color=okabe_ito)

CSS

Paste the lines from CSS into :root to use them as custom properties.

:root {
  --okabe-ito-orange: #E69F00;
  --okabe-ito-sky-blue: #56B4E9;
}

How this page works

The swatches on this page are drawn in the browser by JavaScript, not generated as images (the R figures below them are images produced by R at render time). No libraries are involved. Three files do all the work:

File Role
palettes-data.js An array holding only the color data (names and HEX)
palette.js Reads the data and builds the swatches and copy features
palette.css Appearance. Light and dark follow the site theme

The text only needs an empty block like the one below. palette.js looks up the data by the data-palette value and fills the block in.

::: {data-palette="okabe-ito"}
:::

The front matter of the QMD loads the CSS and JavaScript.

css: palette.css
include-after-body:
  text: |
    <script src="palettes-data.js"></script>
    <script src="palette.js"></script>

To add a palette, add an entry to palettes-data.js and place an empty block in the text. Copying uses navigator.clipboard, and falls back to execCommand("copy") where it is unavailable.

The actual files are included below in collapsible sections. Each starts with an overview comment, and sections inside have their own comments.

/*
 * palettes-data.js — the colors shown in this post
 * -------------------------------------------------------------------------
 * This file is data only. palette.js reads it and draws the swatches.
 *
 * To add a palette:
 *   1. Append an object to the array below.
 *   2. In index.qmd, place an empty block where it should appear:
 *        ::: {data-palette="your-id"}
 *        :::
 *
 * Fields of each palette object:
 *   id      Unique name. Matches data-palette in index.qmd, and prefixes the
 *           variable names produced by the "CSS" copy button.
 *   kind    "categorical": distinct colors for groups (legends, bars, lines).
 *           "sequential":  ordered colors for low-to-high values. These also
 *                          get a smooth gradient strip above the swatches.
 *   cvd     true if the palette was designed for color vision diversity.
 *           Shows a "color-vision friendly" chip. Leave false when unsure.
 *   source  { label, url } for the credit link. Optional.
 *   colors  List of [name, hex] pairs, in display order. Use 6-digit hex
 *           ("#E69F00"). Use null as the name for unnamed colors; they are
 *           numbered in the CSS output instead.
 *
 * Names are English on purpose: they are shared by the Japanese and English
 * pages, and they double as CSS variable names (--okabe-ito-sky-blue).
 */
window.PALETTE_DATA = [
  {
    id: "okabe-ito",
    kind: "categorical",
    cvd: true,
    source: { label: "Okabe & Ito (2008)", url: "https://jfly.uni-koeln.de/color/" },
    colors: [
      ["Black", "#000000"],
      ["Orange", "#E69F00"],
      ["Sky blue", "#56B4E9"],
      ["Bluish green", "#009E73"],
      ["Yellow", "#F0E442"],
      ["Blue", "#0072B2"],
      ["Vermillion", "#D55E00"],
      ["Reddish purple", "#CC79A7"],
    ],
  },
  {
    id: "tol-bright",
    kind: "categorical",
    cvd: true,
    source: { label: "Paul Tol", url: "https://sronpersonalpages.nl/~pault/" },
    colors: [
      ["Blue", "#4477AA"],
      ["Cyan", "#66CCEE"],
      ["Green", "#228833"],
      ["Yellow", "#CCBB44"],
      ["Red", "#EE6677"],
      ["Purple", "#AA3377"],
      ["Grey", "#BBBBBB"],
    ],
  },
  {
    id: "tol-vibrant",
    kind: "categorical",
    cvd: true,
    source: { label: "Paul Tol", url: "https://sronpersonalpages.nl/~pault/" },
    colors: [
      ["Orange", "#EE7733"],
      ["Blue", "#0077BB"],
      ["Cyan", "#33BBEE"],
      ["Magenta", "#EE3377"],
      ["Red", "#CC3311"],
      ["Teal", "#009988"],
      ["Grey", "#BBBBBB"],
    ],
  },
  {
    id: "tol-muted",
    kind: "categorical",
    cvd: true,
    source: { label: "Paul Tol", url: "https://sronpersonalpages.nl/~pault/" },
    colors: [
      ["Rose", "#CC6677"],
      ["Indigo", "#332288"],
      ["Sand", "#DDCC77"],
      ["Green", "#117733"],
      ["Cyan", "#88CCEE"],
      ["Wine", "#882255"],
      ["Teal", "#44AA99"],
      ["Olive", "#999933"],
      ["Purple", "#AA4499"],
      ["Pale grey", "#DDDDDD"],
    ],
  },
  {
    id: "viridis",
    kind: "sequential",
    cvd: true,
    source: { label: "viridis", url: "https://sjmgarnier.github.io/viridisLite/" },
    colors: [
      [null, "#440154"],
      [null, "#46337E"],
      [null, "#365C8D"],
      [null, "#277F8E"],
      [null, "#1FA187"],
      [null, "#4AC16D"],
      [null, "#9FDA3A"],
      [null, "#FDE725"],
    ],
  },
  {
    id: "tableau-10",
    kind: "categorical",
    cvd: false,
    source: { label: "Tableau", url: "https://www.tableau.com/blog/colors-upgrade-tableau-10-56782" },
    colors: [
      ["Blue", "#4E79A7"],
      ["Orange", "#F28E2B"],
      ["Red", "#E15759"],
      ["Teal", "#76B7B2"],
      ["Green", "#59A14F"],
      ["Yellow", "#EDC948"],
      ["Purple", "#B07AA1"],
      ["Pink", "#FF9DA7"],
      ["Brown", "#9C755F"],
      ["Grey", "#BAB0AC"],
    ],
  },
  {
    id: "flexoki-600",
    kind: "categorical",
    cvd: false,
    source: { label: "Flexoki", url: "https://stephango.com/flexoki" },
    colors: [
      ["Red", "#AF3029"],
      ["Orange", "#BC5215"],
      ["Yellow", "#AD8301"],
      ["Green", "#66800B"],
      ["Cyan", "#24837B"],
      ["Blue", "#205EA6"],
      ["Purple", "#5E409D"],
      ["Magenta", "#A02F6F"],
    ],
  },
  {
    id: "flexoki-400",
    kind: "categorical",
    cvd: false,
    source: { label: "Flexoki", url: "https://stephango.com/flexoki" },
    colors: [
      ["Red", "#D14D41"],
      ["Orange", "#DA702C"],
      ["Yellow", "#D0A215"],
      ["Green", "#879A39"],
      ["Cyan", "#3AA99F"],
      ["Blue", "#4385BE"],
      ["Purple", "#8B7EC8"],
      ["Magenta", "#CE5D97"],
    ],
  },
];
/*
 * palette.js — click-to-copy color palette renderer
 * -------------------------------------------------------------------------
 * How the pieces fit together:
 *
 *   palettes-data.js   defines window.PALETTE_DATA (the colors)
 *   index.qmd          places empty blocks such as <div data-palette="okabe-ito">
 *   palette.js (this)  finds those blocks and fills them with swatches
 *   palette.css        styles the result
 *
 * Two kinds of placeholders are recognized:
 *
 *   <div data-palette="ID">   -> one palette: swatches + "Copy all" buttons
 *   <div data-palette-format> -> the HEX / RGB / HSL switch (optional, once per page)
 *
 * No libraries are used. Everything is built with plain DOM APIs.
 */
(() => {
  "use strict";

  // ==== 1. Language ========================================================
  // Quarto writes the page language into <html lang="...">. The Japanese and
  // English builds share this file, so UI strings are picked here.
  const LANG = (document.documentElement.lang || "en").toLowerCase().startsWith("ja") ? "ja" : "en";
  const TEXT = {
    ja: {
      colors: (n) => `${n} 色`,
      categorical: "カテゴリ向け",
      sequential: "連続値向け",
      cvd: "色覚多様性に配慮",
      copied: "コピーしました",
      failed: "コピーできませんでした",
      copyOne: "コピー",
      copyAll: "まとめてコピー",
      formatLabel: "コピーする形式",
      source: "出典",
    },
    en: {
      colors: (n) => `${n} colors`,
      categorical: "Categorical",
      sequential: "Sequential",
      cvd: "Color-vision friendly",
      copied: "Copied",
      failed: "Copy failed",
      copyOne: "Copy",
      copyAll: "Copy all",
      formatLabel: "Copy format",
      source: "Source",
    },
  }[LANG];

  // ==== 2. Color helpers ===================================================
  // The data only stores HEX strings. Everything else is derived from them.

  // "#E69F00" -> [230, 159, 0]
  const hexToRgb = (hex) => {
    const n = parseInt(hex.slice(1), 16);
    return [(n >> 16) & 255, (n >> 8) & 255, n & 255];
  };

  // sRGB channel (0-255) -> linear light (0-1), as defined by WCAG.
  const linear = (c) => {
    const v = c / 255;
    return v <= 0.04045 ? v / 12.92 : ((v + 0.055) / 1.055) ** 2.4;
  };

  // Relative luminance: 0 is black, 1 is white. Green counts most because the
  // eye is most sensitive to it.
  const luminance = ([r, g, b]) => 0.2126 * linear(r) + 0.7152 * linear(g) + 0.0722 * linear(b);

  // Choose black or white text for a given background. WCAG's contrast ratio
  // between luminances L1 >= L2 is (L1 + 0.05) / (L2 + 0.05). We compute it
  // against black (L = 0) and white (L = 1) and take whichever is larger.
  const inkFor = (hex) => {
    const L = luminance(hexToRgb(hex));
    const vsBlack = (L + 0.05) / 0.05;
    const vsWhite = 1.05 / (L + 0.05);
    return vsBlack >= vsWhite ? "#0b0b0b" : "#ffffff";
  };

  // [r, g, b] (0-255) -> [hue 0-360, saturation %, lightness %]
  const toHsl = ([r8, g8, b8]) => {
    const r = r8 / 255, g = g8 / 255, b = b8 / 255;
    const max = Math.max(r, g, b), min = Math.min(r, g, b);
    const l = (max + min) / 2;
    const d = max - min; // chroma; 0 means a gray
    let h = 0, s = 0;
    if (d !== 0) {
      s = d / (1 - Math.abs(2 * l - 1));
      if (max === r) h = ((g - b) / d) % 6;
      else if (max === g) h = (b - r) / d + 2;
      else h = (r - g) / d + 4;
      h *= 60;
      if (h < 0) h += 360;
    }
    return [Math.round(h), Math.round(s * 100), Math.round(l * 100)];
  };

  // "Okabe Ito" -> "okabe-ito" (used for CSS variable names)
  const slug = (s) => s.toLowerCase().replace(/[^a-z0-9]+/g, "-").replace(/^-|-$/g, "");

  // ==== 3. What gets copied ================================================

  // (a) One color. The reader picks the format with the switch at the top.
  const FORMATS = {
    hex: (hex) => hex.toUpperCase(),
    rgb: (hex) => `rgb(${hexToRgb(hex).join(", ")})`,
    hsl: (hex) => {
      const [h, s, l] = toHsl(hexToRgb(hex));
      return `hsl(${h}, ${s}%, ${l}%)`;
    },
  };

  // (b) A whole palette. Always HEX, because R, Python and CSS all accept it.
  // The key is the button label; the function receives one palette object.
  const hexes = (p) => p.colors.map(([, hex]) => hex.toUpperCase());
  const BULK = {
    HEX: (p) => hexes(p).join(", "),
    R: (p) => `c(${hexes(p).map((h) => `"${h}"`).join(", ")})`,
    Python: (p) => `[${hexes(p).map((h) => `"${h}"`).join(", ")}]`,
    // Named colors become --palette-colorname; unnamed ones are numbered.
    CSS: (p) =>
      p.colors
        .map(([name, hex], i) => `--${p.id}-${name ? slug(name) : i + 1}: ${hex.toUpperCase()};`)
        .join("\n"),
    JSON: (p) => JSON.stringify(hexes(p)),
  };

  // ==== 4. Clipboard and feedback ==========================================

  // Returns true on success. The modern Clipboard API needs a secure context
  // (https or localhost), so we fall back to the old execCommand trick, which
  // also works when the page is opened from file://.
  const copyText = async (text) => {
    try {
      await navigator.clipboard.writeText(text);
      return true;
    } catch (_) {
      // fall through to the legacy path
    }
    try {
      const ta = document.createElement("textarea");
      ta.value = text;
      ta.setAttribute("readonly", "");
      ta.style.cssText = "position:fixed;top:0;left:0;opacity:0"; // keep it out of sight
      document.body.appendChild(ta);
      ta.select();
      const ok = document.execCommand("copy");
      ta.remove();
      return ok;
    } catch (_) {
      return false;
    }
  };

  // Screen-reader announcement. Sighted users see the "Copied" pill; this
  // hidden live region says the same thing out loud.
  let live;
  const announce = (msg) => {
    if (!live) {
      live = document.createElement("div");
      live.className = "visually-hidden"; // Bootstrap's screen-reader-only class
      live.setAttribute("role", "status");
      live.setAttribute("aria-live", "polite");
      document.body.appendChild(live);
    }
    live.textContent = "";
    // Set the text slightly later so an identical message is announced again.
    setTimeout(() => (live.textContent = msg), 50);
  };

  // One timer per element, so clicking twice quickly restarts the countdown
  // instead of clearing the feedback early.
  const timers = new WeakMap();
  const later = (node, ms, fn) => {
    clearTimeout(timers.get(node));
    timers.set(node, setTimeout(fn, ms));
  };

  // Show "Copied" on a swatch. CSS draws the pill from the classes below and
  // reads its text from the data-msg attribute (see palette.css).
  const flash = (node, ok, text) => {
    node.dataset.msg = ok ? TEXT.copied : TEXT.failed;
    node.classList.toggle("is-copied", ok);
    node.classList.toggle("is-failed", !ok);
    announce(`${ok ? TEXT.copied : TEXT.failed}: ${text}`);
    later(node, 1400, () => node.classList.remove("is-copied", "is-failed"));
  };

  // ==== 5. Single-color format state =======================================
  // The chosen format is remembered in localStorage as a small convenience.
  // Storage can be blocked (private windows, strict settings), so every access
  // is wrapped in try/catch and the page works without it.
  const STORE_KEY = "palette-copy-format";
  let format = "hex";
  try {
    const saved = localStorage.getItem(STORE_KEY);
    if (saved && FORMATS[saved]) format = saved;
  } catch (_) {}

  // Every swatch registers here so a format change can relabel all of them.
  const swatches = []; // { btn, valueEl, hex, name }
  const formatButtons = [];

  // Update one swatch's visible value and its accessible name.
  const refreshSwatch = ({ btn, valueEl, hex, name }) => {
    const value = FORMATS[format](hex);
    valueEl.textContent = value;
    btn.setAttribute("aria-label", `${TEXT.copyOne}: ${name ? name + " " : ""}${value}`);
  };

  const setFormat = (next) => {
    format = next;
    try {
      localStorage.setItem(STORE_KEY, next);
    } catch (_) {}
    swatches.forEach(refreshSwatch);
    formatButtons.forEach((b) => b.setAttribute("aria-pressed", String(b.dataset.format === next)));
  };

  // ==== 6. DOM builders ====================================================

  // Tiny helper: el("span", "palette-name", "Orange") -> <span class="palette-name">Orange</span>
  // textContent is used (never innerHTML), so data can't inject markup.
  const el = (tag, className, text) => {
    const node = document.createElement(tag);
    if (className) node.className = className;
    if (text != null) node.textContent = text;
    return node;
  };

  // One clickable color tile.
  const buildSwatch = ([name, hex]) => {
    const btn = el("button", "palette-swatch");
    btn.type = "button";
    // CSS reads these two custom properties for the background and text color.
    btn.style.setProperty("--sw-bg", hex);
    btn.style.setProperty("--sw-fg", inkFor(hex));
    if (name) btn.appendChild(el("span", "palette-name", name));
    const valueEl = el("span", "palette-value");
    btn.appendChild(valueEl);

    const item = { btn, valueEl, hex, name };
    swatches.push(item);
    refreshSwatch(item); // fills in the value text for the current format

    btn.addEventListener("click", async () => {
      const text = FORMATS[format](hex); // read the format at click time
      flash(btn, await copyText(text), text);
    });
    return btn;
  };

  // The line above the swatches: count, kind, color-vision note, source link.
  const buildMeta = (p) => {
    const meta = el("p", "palette-meta");
    meta.appendChild(el("span", null, TEXT.colors(p.colors.length)));
    meta.appendChild(el("span", "palette-chip", p.kind === "sequential" ? TEXT.sequential : TEXT.categorical));
    if (p.cvd) meta.appendChild(el("span", "palette-chip palette-chip-cvd", TEXT.cvd));
    if (p.source) {
      const a = el("a", null, `${TEXT.source}: ${p.source.label}`);
      a.href = p.source.url;
      a.target = "_blank";
      a.rel = "noopener noreferrer"; // don't hand the new tab a reference to this one
      meta.appendChild(a);
    }
    return meta;
  };

  // The "Copy all: HEX R Python CSS JSON" row under a palette.
  const buildTools = (p) => {
    const tools = el("div", "palette-tools");
    tools.setAttribute("role", "group");
    tools.setAttribute("aria-label", TEXT.copyAll);
    tools.appendChild(el("span", "palette-tools-label", TEXT.copyAll));

    Object.entries(BULK).forEach(([label, make]) => {
      const b = el("button", "palette-btn", label);
      b.type = "button";
      b.addEventListener("click", async () => {
        const ok = await copyText(make(p));
        // Briefly swap the label for a check mark, then restore it.
        b.textContent = ok ? `✓ ${label}` : TEXT.failed;
        b.classList.toggle("is-copied", ok);
        announce(`${ok ? TEXT.copied : TEXT.failed}: ${label}`);
        later(b, 1400, () => {
          b.textContent = label;
          b.classList.remove("is-copied");
        });
      });
      tools.appendChild(b);
    });
    return tools;
  };

  // Fill one <div data-palette="ID"> placeholder.
  const renderPalette = (root) => {
    const p = (window.PALETTE_DATA || []).find((d) => d.id === root.dataset.palette);
    if (!p) {
      // A typo in the id should be obvious while writing, not fail silently.
      root.textContent = `Unknown palette: ${root.dataset.palette}`;
      return;
    }
    root.classList.add("palette");
    root.replaceChildren(buildMeta(p));

    // Sequential palettes get a smooth gradient strip above the discrete swatches.
    if (p.kind === "sequential") {
      const ribbon = el("div", "palette-ribbon");
      ribbon.setAttribute("aria-hidden", "true"); // decorative
      ribbon.style.background = `linear-gradient(to right, ${p.colors.map(([, h]) => h).join(", ")})`;
      root.appendChild(ribbon);
    }

    const grid = el("div", "palette-grid");
    p.colors.forEach((c) => grid.appendChild(buildSwatch(c)));
    root.append(grid, buildTools(p));
  };

  // Fill the <div data-palette-format> placeholder with the HEX/RGB/HSL switch.
  const renderFormatSwitch = (root) => {
    root.classList.add("palette-format");
    root.setAttribute("role", "group");
    root.setAttribute("aria-label", TEXT.formatLabel);
    root.replaceChildren(el("span", "palette-tools-label", TEXT.formatLabel));

    const seg = el("div", "palette-seg");
    Object.keys(FORMATS).forEach((key) => {
      const b = el("button", "palette-seg-btn", key.toUpperCase());
      b.type = "button";
      b.dataset.format = key;
      // aria-pressed drives both the screen-reader state and the CSS highlight.
      b.setAttribute("aria-pressed", String(key === format));
      b.addEventListener("click", () => setFormat(key));
      formatButtons.push(b);
      seg.appendChild(b);
    });
    root.appendChild(seg);
  };

  // ==== 7. Entry point =====================================================
  // The format switch is built first so the saved format is already applied
  // when the swatches are created.
  const init = () => {
    document.querySelectorAll("[data-palette-format]").forEach(renderFormatSwitch);
    document.querySelectorAll("[data-palette]").forEach(renderPalette);
  };

  if (document.readyState === "loading") document.addEventListener("DOMContentLoaded", init);
  else init();
})();
/*
 * palette.css — styles for the click-to-copy palettes
 * -------------------------------------------------------------------------
 * palette.js builds this structure:
 *
 *   .palette
 *     .palette-meta        count, kind chip, source link
 *     .palette-ribbon      gradient strip (sequential palettes only)
 *     .palette-grid
 *       button.palette-swatch  (one per color)
 *         .palette-name, .palette-value
 *     .palette-tools       "Copy all" row of .palette-btn
 *
 *   .palette-format        HEX / RGB / HSL switch (.palette-seg-btn)
 *
 * Theming: everything except the swatches themselves uses Bootstrap's CSS
 * variables (--bs-body-color, --bs-border-color, ...). Quarto swaps those
 * when the reader toggles dark mode, so no dark-mode rules are needed here.
 * The second argument of each var() is a fallback in case a variable is missing.
 *
 * The swatch colors come from JS as inline custom properties:
 *   --sw-bg  the swatch color
 *   --sw-fg  black or white text, whichever contrasts better
 */

.palette {
  margin: 0.75rem 0 2.25rem;
}

/* ---- meta line ---------------------------------------------------------- */

.palette-meta {
  display: flex;
  flex-wrap: wrap;
  align-items: center;
  gap: 0.4rem 0.75rem;
  margin: 0 0 0.7rem;
  font-size: 0.85rem;
  color: var(--bs-secondary-color, #6c757d);
}

.palette-chip {
  padding: 0.05rem 0.6rem;
  border: 1px solid var(--bs-border-color, #dee2e6);
  border-radius: 999px;
  font-size: 0.78rem;
  line-height: 1.5;
  color: var(--bs-body-color);
}

.palette-chip-cvd {
  border-color: color-mix(in srgb, var(--bs-link-color, #0d6efd) 55%, transparent);
  color: var(--bs-link-color, #0d6efd);
}

/* ---- gradient ribbon (sequential palettes) ------------------------------ */

.palette-ribbon {
  height: 0.9rem;
  margin-bottom: 0.6rem;
  border: 1px solid var(--bs-border-color, #dee2e6);
  border-radius: 0.45rem;
}

/* ---- swatches ------------------------------------------------------------ */

.palette-grid {
  display: grid;
  grid-template-columns: repeat(auto-fill, minmax(8.5rem, 1fr));
  gap: 0.6rem;
}

/* A swatch is a real <button>, so keyboard focus and Enter/Space work for free. */
.palette-swatch {
  position: relative;
  display: flex;
  flex-direction: column;
  justify-content: flex-end;
  align-items: flex-start;
  gap: 0.1rem;
  min-height: 6.5rem;
  padding: 0.7rem 0.8rem;
  /* A faint outline so very light swatches (yellow, grey) and very dark ones
     (black on a dark page) don't vanish into the background. */
  border: 1px solid color-mix(in srgb, var(--bs-body-color, #888) 22%, transparent);
  border-radius: 0.65rem;
  background: var(--sw-bg);
  color: var(--sw-fg);
  font: inherit;
  text-align: left;
  cursor: pointer;
  transition: transform 0.12s ease, box-shadow 0.12s ease;
}

.palette-swatch:hover {
  transform: translateY(-2px);
  box-shadow: 0 6px 14px rgba(0, 0, 0, 0.18);
}

.palette-swatch:active {
  transform: scale(0.98);
}

.palette-swatch:focus-visible,
.palette-btn:focus-visible,
.palette-seg-btn:focus-visible {
  outline: 3px solid var(--bs-link-color, #0d6efd);
  outline-offset: 2px;
}

.palette-name {
  font-size: 0.8rem;
  line-height: 1.25;
  opacity: 0.88;
}

.palette-value {
  font-family: var(--bs-font-monospace, ui-monospace, SFMono-Regular, Menlo, Consolas, monospace);
  font-size: 0.95rem;
  font-weight: 600;
  letter-spacing: 0.01em;
}

/* "Copied" pill. JS adds .is-copied (or .is-failed) for about 1.4 s and puts
   the message in data-msg. The pill swaps the swatch's text and background
   colors, so it is readable on any color. */
.palette-swatch.is-copied::after,
.palette-swatch.is-failed::after {
  content: attr(data-msg);
  position: absolute;
  top: 0.55rem;
  right: 0.6rem;
  padding: 0.1rem 0.55rem;
  border-radius: 999px;
  background: var(--sw-fg);
  color: var(--sw-bg);
  font-size: 0.72rem;
  font-weight: 600;
  line-height: 1.5;
  animation: palette-pop 0.18s ease-out;
}

.palette-swatch.is-copied::after {
  content: "✓ " attr(data-msg);
}

@keyframes palette-pop {
  from {
    opacity: 0;
    transform: translateY(4px);
  }
  to {
    opacity: 1;
    transform: none;
  }
}

/* ---- toolbars ------------------------------------------------------------ */

.palette-tools,
.palette-format {
  display: flex;
  flex-wrap: wrap;
  align-items: center;
  gap: 0.4rem;
}

.palette-tools {
  margin-top: 0.8rem;
}

.palette-format {
  margin: 0.5rem 0 1.5rem;
}

.palette-tools-label {
  margin-right: 0.2rem;
  font-size: 0.82rem;
  color: var(--bs-secondary-color, #6c757d);
}

.palette-btn {
  padding: 0.2rem 0.7rem;
  border: 1px solid var(--bs-border-color, #dee2e6);
  border-radius: 999px;
  background: transparent;
  color: var(--bs-body-color);
  font-family: var(--bs-font-monospace, ui-monospace, Menlo, Consolas, monospace);
  font-size: 0.8rem;
  line-height: 1.5;
  cursor: pointer;
}

.palette-btn:hover {
  background: var(--bs-tertiary-bg, rgba(128, 128, 128, 0.12));
}

.palette-btn.is-copied {
  border-color: var(--bs-link-color, #0d6efd);
  color: var(--bs-link-color, #0d6efd);
}

/* segmented control for the single-color format */
.palette-seg {
  display: inline-flex;
  border: 1px solid var(--bs-border-color, #dee2e6);
  border-radius: 999px;
  overflow: hidden;
}

.palette-seg-btn {
  padding: 0.25rem 0.9rem;
  border: 0;
  background: transparent;
  color: var(--bs-body-color);
  font-family: var(--bs-font-monospace, ui-monospace, Menlo, Consolas, monospace);
  font-size: 0.8rem;
  cursor: pointer;
}

.palette-seg-btn + .palette-seg-btn {
  border-left: 1px solid var(--bs-border-color, #dee2e6);
}

.palette-seg-btn:hover {
  background: var(--bs-tertiary-bg, rgba(128, 128, 128, 0.12));
}

.palette-seg-btn[aria-pressed="true"] {
  background: var(--bs-body-color);
  color: var(--bs-body-bg);
}

@media (max-width: 480px) {
  .palette-grid {
    grid-template-columns: repeat(2, minmax(0, 1fr));
  }
}

@media (prefers-reduced-motion: reduce) {
  .palette-swatch,
  .palette-swatch.is-copied::after,
  .palette-swatch.is-failed::after {
    transition: none;
    animation: none;
  }
}

References

Garnier, Simon, Noam Ross, Bob Rudis, Marco Sciaini, Antônio Pedro Camargo, and Cédric Scherer. 2024. viridis: Colorblind-Friendly Color Maps for R. https://doi.org/10.32614/CRAN.package.viridis.
Nuñez, Jamie R., Christopher R. Anderton, and Ryan S. Renslow. 2018. “Optimizing Colormaps with Consideration for Color Vision Deficiency to Enable Accurate Interpretation of Scientific Data.” PLOS ONE 13 (7): e0199239. https://doi.org/10.1371/journal.pone.0199239.
Okabe, Masataka, and Kei Ito. 2008. Color Universal Design (CUD) / Colorblind Barrier Free. https://jfly.uni-koeln.de/color/.
R Core Team. n.d. Set or View the Graphics Palette. The R Foundation for Statistical Computing. Accessed November 7, 2026. https://stat.ethz.ch/R-manual/R-devel/library/grDevices/html/palette.html.
Smith, Nathaniel, and Stéfan van der Walt. 2015. A Better Default Colormap for Matplotlib. Talk at SciPy 2015. https://www.youtube.com/watch?v=xAoljeRJ3lU.
Stone, Maureen. 2016. “How We Designed the New Color Palettes in Tableau 10.” Tableau, July 28. https://www.tableau.com/blog/colors-upgrade-tableau-10-56782.
Tol, Paul. 2021. Colour Schemes. Technical Note SRON/EPS/TN/09-002. SRON Netherlands Institute for Space Research. https://sronpersonalpages.nl/~pault/data/colourschemes.pdf.
Wong, Bang. 2011. “Points of View: Color Blindness.” Nature Methods 8 (6): 441. https://doi.org/10.1038/nmeth.1618.

Footnotes

  1. palette.colors() was added in R 4.0.0. It is listed under New Features in the R NEWS (Changes in R 4.0.0).↩︎

  2. In the development source of R, colorstuff.R, .palette_colors_hex defines "Okabe-Ito" with nine colors, ending in gray = "#999999".↩︎