Notes on Chain Code

r
A note on chain code.
Published

2026-02-01

Modified

2026-02-01

Note

Original Japanese version: Chain codeについて

Chain code is a method for representing a shape as a one-dimensional sequence of codes. It encodes the movement direction from one coordinate to an adjacent coordinate for pixels on a contour in a two-dimensional image, then records those directions continuously. It is mainly used in image processing and computer vision, and it is useful for contour extraction and shape recognition.

NoteBasic Paper on Chain Code

The basic concept of chain code was proposed by Freeman (1974). The concept existed before this paper, but this paper helped make the name “chain code” widely known.

For example, a commonly used eight-direction chain code is as follows.

Code
plot(
  0,
  0,
  xlim = c(-1.5, 1.5),
  ylim = c(-1.5, 1.5),
  type = "n",
  xlab = "",
  ylab = "",
  xaxt = "n",
  yaxt = "n",
  asp = 1,
  xaxs = "i",
  yaxs = "i"
)
axis(1, at = c(-1, 0, 1), cex.axis = 2)
axis(2, at = c(-1, 0, 1), las = 1, cex.axis = 2)


# Draw grid lines
abline(h = -1:1, col = "lightgray")
abline(v = -1:1, col = "lightgray")

# Draw vectors
length_arrow <- 0.2
lwd_arrow <- 5
arrows(0, 0, 1, 0, length = length_arrow, lwd = lwd_arrow) # 0
arrows(0, 0, 1, 1, length = length_arrow, lwd = lwd_arrow) # 1
arrows(0, 0, 0, 1, length = length_arrow, lwd = lwd_arrow) # 2
arrows(0, 0, -1, 1, length = length_arrow, lwd = lwd_arrow) # 3
arrows(0, 0, -1, 0, length = length_arrow, lwd = lwd_arrow) # 4
arrows(0, 0, -1, -1, length = length_arrow, lwd = lwd_arrow) # 5
arrows(0, 0, 0, -1, length = length_arrow, lwd = lwd_arrow) # 6
arrows(0, 0, 1, -1, length = length_arrow, lwd = lwd_arrow) # 7

# Add labels
cex_text <- 3
text(1, 0, "0", cex = cex_text, pos = 4)
text(1, 1, "1", cex = cex_text, pos = 4)
text(0, 1, "2", cex = cex_text, pos = 3)
text(-1, 1, "3", cex = cex_text, pos = 2)
text(-1, 0, "4", cex = cex_text, pos = 2)
text(-1, -1, "5", cex = cex_text, pos = 2)
text(0, -1, "6", cex = cex_text, pos = 1)
text(1, -1, "7", cex = cex_text, pos = 4)

This code shows movement from the center point in eight directions. Numbers from 0 to 7 are assigned to the directions. These numbers are used to encode movement while tracing the contour of a shape.

NoteOther Chain Codes

This article introduces the eight-direction chain code, but four-direction chain codes also exist. In a four-direction chain code, numbers are assigned only to the four directions up, down, left, and right. Four-direction chain codes require less computation, but they may be unsuitable for representing fine shape details.

Also, this article uses a scheme where the rightward direction is 0, but the numbering scheme can differ by paper or implementation. When using chain codes, it is important to check which scheme is being used.

Example of Representing a Contour with Chain Code

Suppose we have the following contour shape. It is an image of a cat face.

df_contour <- data.frame(
  x = c(0, 0, 1, 2, 3, 4, 5, 5, 5, 4, 3, 2, 1, 0, 0),
  y = c(0, -1, -2, -2, -2, -2, -1, 0, 1, 2, 1, 1, 2, 1, 0)
)
plot(
  df_contour$x,
  df_contour$y,
  type = "n",
  xlab = "X",
  ylab = "Y",
  asp = 1,
  xaxs = "i",
  yaxs = "i",
  xlim = c(-1, 6),
  ylim = c(-3, 3),
  xaxt = "n",
  yaxt = "n",
  cex.lab = 1.5
)
axis(1, at = 0:5, cex.axis = 1.5)
axis(2, at = -2:2, las = 1, cex.axis = 1.5)
abline(h = -3:3, col = "lightgray")
abline(v = -1:6, col = "lightgray")
lines(df_contour$x, df_contour$y, lwd = 3)
points(df_contour$x, df_contour$y, pch = 19, cex = 1.5)

Representing this contour with chain code gives the following. Assume that the starting point is (0, 0) and the contour is traced clockwise.

(0,0),6,7,0,0,0,1,2,2,3,5,4,3,5,6
NoteDirection of Contour Tracing

This example traces the contour clockwise, but it is also possible to trace it counterclockwise.

Each number corresponds to the eight-direction chain code described above. For example, the first 6 indicates movement from (0, 0) to (0, -1), and the next 7 indicates movement from (0, -1) to (1, -1).

Now overlay the vectors on the previous figure.

plot(
  df_contour$x,
  df_contour$y,
  type = "n",
  xlab = "X",
  ylab = "Y",
  asp = 1,
  xaxs = "i",
  yaxs = "i",
  xlim = c(-1, 6),
  ylim = c(-3, 3),
  xaxt = "n",
  yaxt = "n",
  cex.lab = 1.5
)
axis(1, at = 0:5, cex.axis = 1.5)
axis(2, at = -2:2, las = 1, cex.axis = 1.5)
abline(h = -3:3, col = "lightgray")
abline(v = -1:6, col = "lightgray")

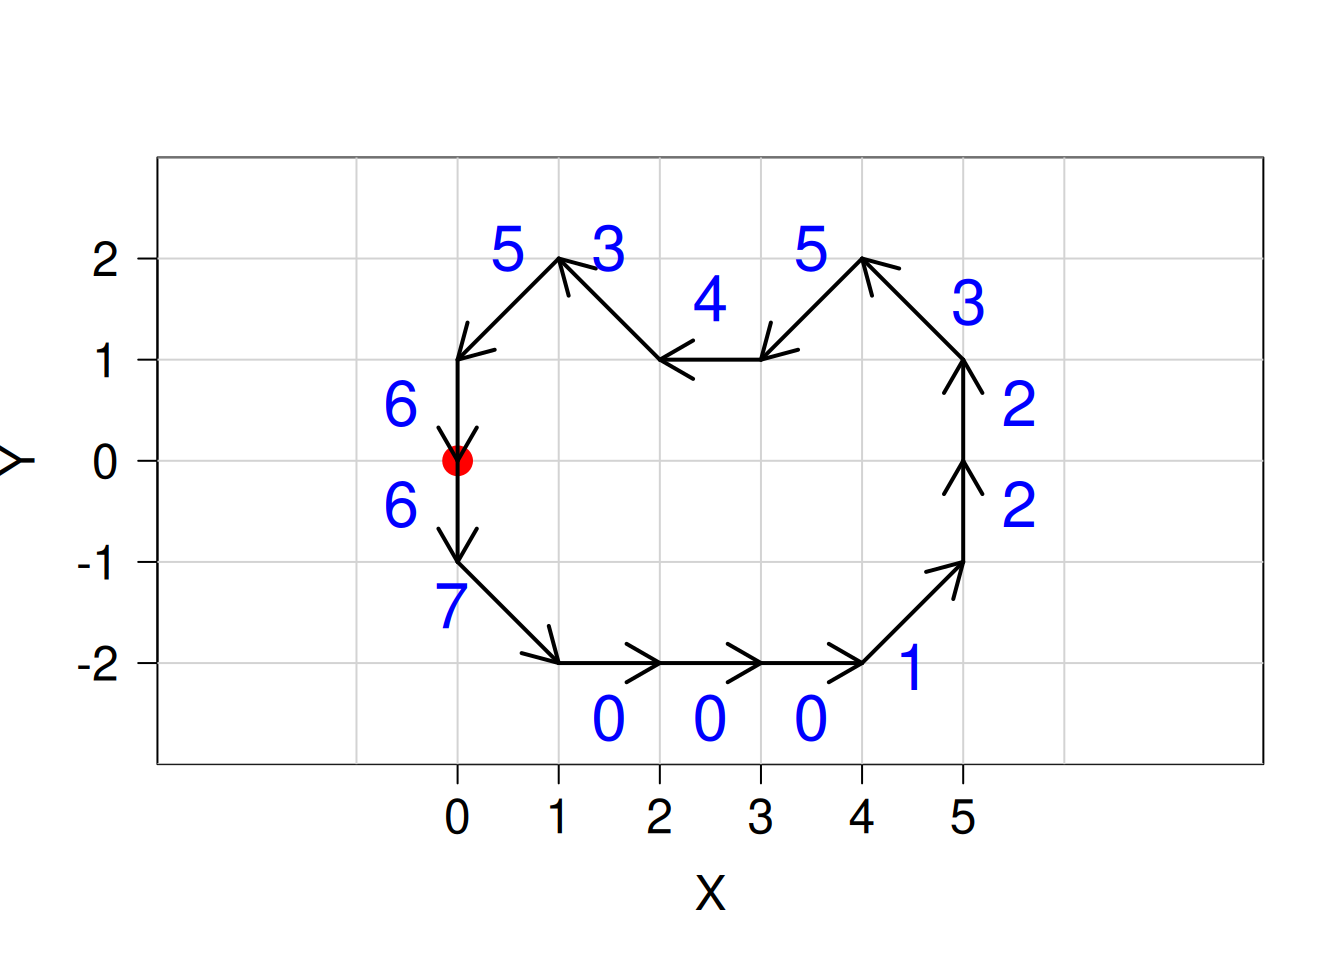
points(df_contour$x[1], df_contour$y[1], pch = 19, cex = 2, col = "red") # starting point

# Draw vectors
length_arrow <- 0.2
lwd_arrow <- 2
arrows(0, 0, 0, -1, length = length_arrow, lwd = lwd_arrow) # 6
arrows(0, -1, 1, -2, length = length_arrow, lwd = lwd_arrow) # 7
arrows(1, -2, 2, -2, length = length_arrow, lwd = lwd_arrow) # 0
arrows(2, -2, 3, -2, length = length_arrow, lwd = lwd_arrow) # 0
arrows(3, -2, 4, -2, length = length_arrow, lwd = lwd_arrow) # 0
arrows(4, -2, 5, -1, length = length_arrow, lwd = lwd_arrow) # 1
arrows(5, -1, 5, 0, length = length_arrow, lwd = lwd_arrow) # 2
arrows(5, 0, 5, 1, length = length_arrow, lwd = lwd_arrow) # 2
arrows(5, 1, 4, 2, length = length_arrow, lwd = lwd_arrow) # 3
arrows(4, 2, 3, 1, length = length_arrow, lwd = lwd_arrow) # 5
arrows(3, 1, 2, 1, length = length_arrow, lwd = lwd_arrow) # 4
arrows(2, 1, 1, 2, length = length_arrow, lwd = lwd_arrow) # 3
arrows(1, 2, 0, 1, length = length_arrow, lwd = lwd_arrow) # 5
arrows(0, 1, 0, 0, length = length_arrow, lwd = lwd_arrow) # 6

# Add labels
text(
  df_contour$x[-1] +
    c(0, -0.5, -0.5, -0.5, -0.5, -0.5, 0, 0, 0.5, 0.5, 0.5, 0.5, 0.5, 0),
  df_contour$y[-1] +
    c(0.5, 0.5, 0, 0, 0, -0.5, -0.5, -0.5, -0.5, 0.5, 0, -0.5, 0.5, 0.5),
  labels = c(
    "6",
    "7",
    "0",
    "0",
    "0",
    "1",
    "2",
    "2",
    "3",
    "5",
    "4",
    "3",
    "5",
    "6"
  ),
  offset = c(1, rep(0.5, length(df_contour$x) - 1)),
  pos = c(2, 2, 1, 1, 1, 1, 4, 4, 4, 3, 3, 3, 3, 2),
  cex = 2,
  col = "blue"
)

Converting Coordinates to Chain Code

Now convert coordinate data to chain code in R.

# Calculate differences in x and y
dx <- df_contour$x[2:length(df_contour$x)] -
  df_contour$x[1:(length(df_contour$x) - 1)]
dy <- df_contour$y[2:length(df_contour$y)] -
  df_contour$y[1:(length(df_contour$y) - 1)]
# Determine chain code based on the differences
chain_code <- c()
for (i in seq_along(dx)) {
  if (dx[i] == 1 && dy[i] == 0) {
    chain_code <- c(chain_code, 0)
  } else if (dx[i] == 1 && dy[i] == 1) {
    chain_code <- c(chain_code, 1)
  } else if (dx[i] == 0 && dy[i] == 1) {
    chain_code <- c(chain_code, 2)
  } else if (dx[i] == -1 && dy[i] == 1) {
    chain_code <- c(chain_code, 3)
  } else if (dx[i] == -1 && dy[i] == 0) {
    chain_code <- c(chain_code, 4)
  } else if (dx[i] == -1 && dy[i] == -1) {
    chain_code <- c(chain_code, 5)
  } else if (dx[i] == 0 && dy[i] == -1) {
    chain_code <- c(chain_code, 6)
  } else if (dx[i] == 1 && dy[i] == -1) {
    chain_code <- c(chain_code, 7)
  }
}
print(chain_code)
 [1] 6 7 0 0 0 1 2 2 3 5 4 3 5 6

Writing this as a function gives the following.

coords_to_chain_code <- function(x, y) {
  dx <- x[2:length(x)] - x[1:(length(x) - 1)]
  dy <- y[2:length(y)] - y[1:(length(y) - 1)]
  # Error if any displacement is larger than 1
  if (any(abs(dx) > 1) || any(abs(dy) > 1)) {
    stop("Invalid step detected: not 8-connected")
  }
  chain_code <- c()
  for (i in seq_along(dx)) {
    if (dx[i] == 1 && dy[i] == 0) {
      chain_code <- c(chain_code, 0)
    } else if (dx[i] == 1 && dy[i] == 1) {
      chain_code <- c(chain_code, 1)
    } else if (dx[i] == 0 && dy[i] == 1) {
      chain_code <- c(chain_code, 2)
    } else if (dx[i] == -1 && dy[i] == 1) {
      chain_code <- c(chain_code, 3)
    } else if (dx[i] == -1 && dy[i] == 0) {
      chain_code <- c(chain_code, 4)
    } else if (dx[i] == -1 && dy[i] == -1) {
      chain_code <- c(chain_code, 5)
    } else if (dx[i] == 0 && dy[i] == -1) {
      chain_code <- c(chain_code, 6)
    } else if (dx[i] == 1 && dy[i] == -1) {
      chain_code <- c(chain_code, 7)
    }
  }
  return(chain_code)
}

Apply the function to the coordinate data from above.

result_chain_code <- coords_to_chain_code(
  df_contour$x,
  df_contour$y
)
print(result_chain_code)
 [1] 6 7 0 0 0 1 2 2 3 5 4 3 5 6

The same chain code is obtained.

Converting Chain Code to Coordinates

Next, convert chain code back to coordinates. First, write it directly.

chain_code <- c(6, 7, 0, 0, 0, 1, 2, 2, 3, 5, 4, 3, 5, 6)
# Coordinates of the starting point
start_x <- 0
start_y <- 0
# Convert to coordinates
x_coords <- c(start_x)
y_coords <- c(start_y)
for (code in chain_code) {
  last_x <- tail(x_coords, n = 1)
  last_y <- tail(y_coords, n = 1)
  if (code == 0) {
    x_coords <- c(x_coords, last_x + 1)
    y_coords <- c(y_coords, last_y)
  } else if (code == 1) {
    x_coords <- c(x_coords, last_x + 1)
    y_coords <- c(y_coords, last_y + 1)
  } else if (code == 2) {
    x_coords <- c(x_coords, last_x)
    y_coords <- c(y_coords, last_y + 1)
  } else if (code == 3) {
    x_coords <- c(x_coords, last_x - 1)
    y_coords <- c(y_coords, last_y + 1)
  } else if (code == 4) {
    x_coords <- c(x_coords, last_x - 1)
    y_coords <- c(y_coords, last_y)
  } else if (code == 5) {
    x_coords <- c(x_coords, last_x - 1)
    y_coords <- c(y_coords, last_y - 1)
  } else if (code == 6) {
    x_coords <- c(x_coords, last_x)
    y_coords <- c(y_coords, last_y - 1)
  } else if (code == 7) {
    x_coords <- c(x_coords, last_x + 1)
    y_coords <- c(y_coords, last_y - 1)
  }
}
df_from_chain <- data.frame(x = x_coords, y = y_coords)
print(df_from_chain)
   x  y
1  0  0
2  0 -1
3  1 -2
4  2 -2
5  3 -2
6  4 -2
7  5 -1
8  5  0
9  5  1
10 4  2
11 3  1
12 2  1
13 1  2
14 0  1
15 0  0

Plot the result.

plot(
  df_from_chain$x,
  df_from_chain$y,
  type = "l",
  xlab = "X",
  ylab = "Y",
  asp = 1,
  las = 1,
  cex.lab = 1.5,
  cex.axis = 1.5
)

Now turn it into a function.

chain_code_to_coords <- function(chain_code, start_x = 0, start_y = 0) {
  x_coords <- c(start_x)
  y_coords <- c(start_y)
  for (code in chain_code) {
    last_x <- tail(x_coords, n = 1)
    last_y <- tail(y_coords, n = 1)
    if (code == 0) {
      x_coords <- c(x_coords, last_x + 1)
      y_coords <- c(y_coords, last_y)
    } else if (code == 1) {
      x_coords <- c(x_coords, last_x + 1)
      y_coords <- c(y_coords, last_y + 1)
    } else if (code == 2) {
      x_coords <- c(x_coords, last_x)
      y_coords <- c(y_coords, last_y + 1)
    } else if (code == 3) {
      x_coords <- c(x_coords, last_x - 1)
      y_coords <- c(y_coords, last_y + 1)
    } else if (code == 4) {
      x_coords <- c(x_coords, last_x - 1)
      y_coords <- c(y_coords, last_y)
    } else if (code == 5) {
      x_coords <- c(x_coords, last_x - 1)
      y_coords <- c(y_coords, last_y - 1)
    } else if (code == 6) {
      x_coords <- c(x_coords, last_x)
      y_coords <- c(y_coords, last_y - 1)
    } else if (code == 7) {
      x_coords <- c(x_coords, last_x + 1)
      y_coords <- c(y_coords, last_y - 1)
    }
  }
  return(data.frame(x = x_coords, y = y_coords))
}

Apply the function to the chain code from above.

result_coords <- chain_code_to_coords(
  chain_code,
  start_x = 0,
  start_y = 0
)
print(result_coords)
   x  y
1  0  0
2  0 -1
3  1 -2
4  2 -2
5  3 -2
6  4 -2
7  5 -1
8  5  0
9  5  1
10 4  2
11 3  1
12 2  1
13 1  2
14 0  1
15 0  0
plot(
  result_coords$x,
  result_coords$y,
  type = "l",
  xlab = "X",
  ylab = "Y",
  asp = 1,
  las = 1,
  cex.lab = 1.5,
  cex.axis = 1.5
)

References

Freeman, Herbert. 1974. “Computer Processing of Line-Drawing Images.” ACM Comput. Surv. 6 (1): 5797. https://doi.org/10.1145/356625.356627.