plot(1:10, 1:10) # default aspect ratio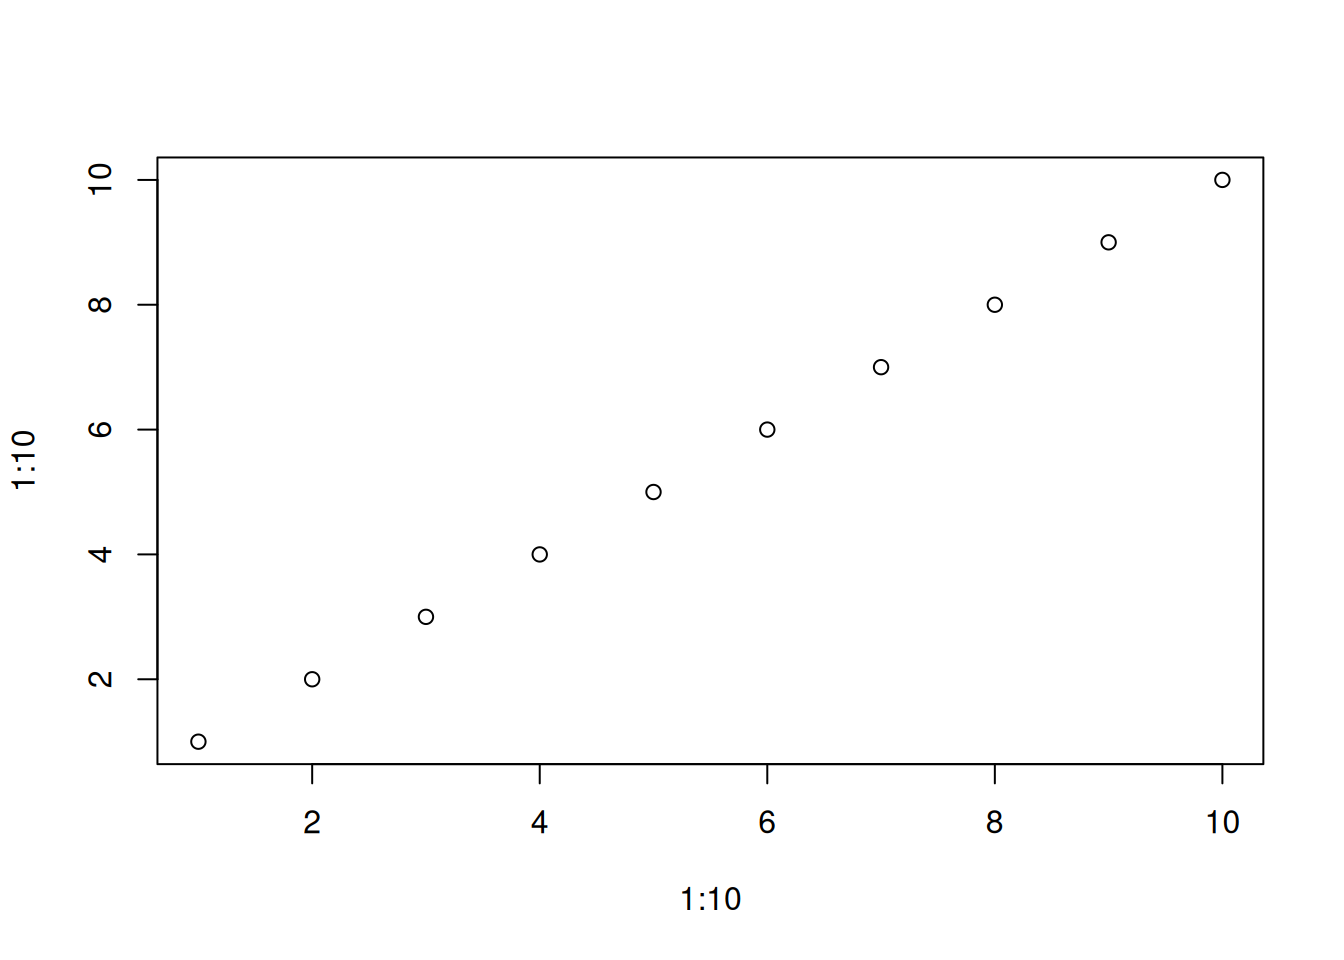
plot(1:10, 1:10, asp = 1) # aspect ratio 1:1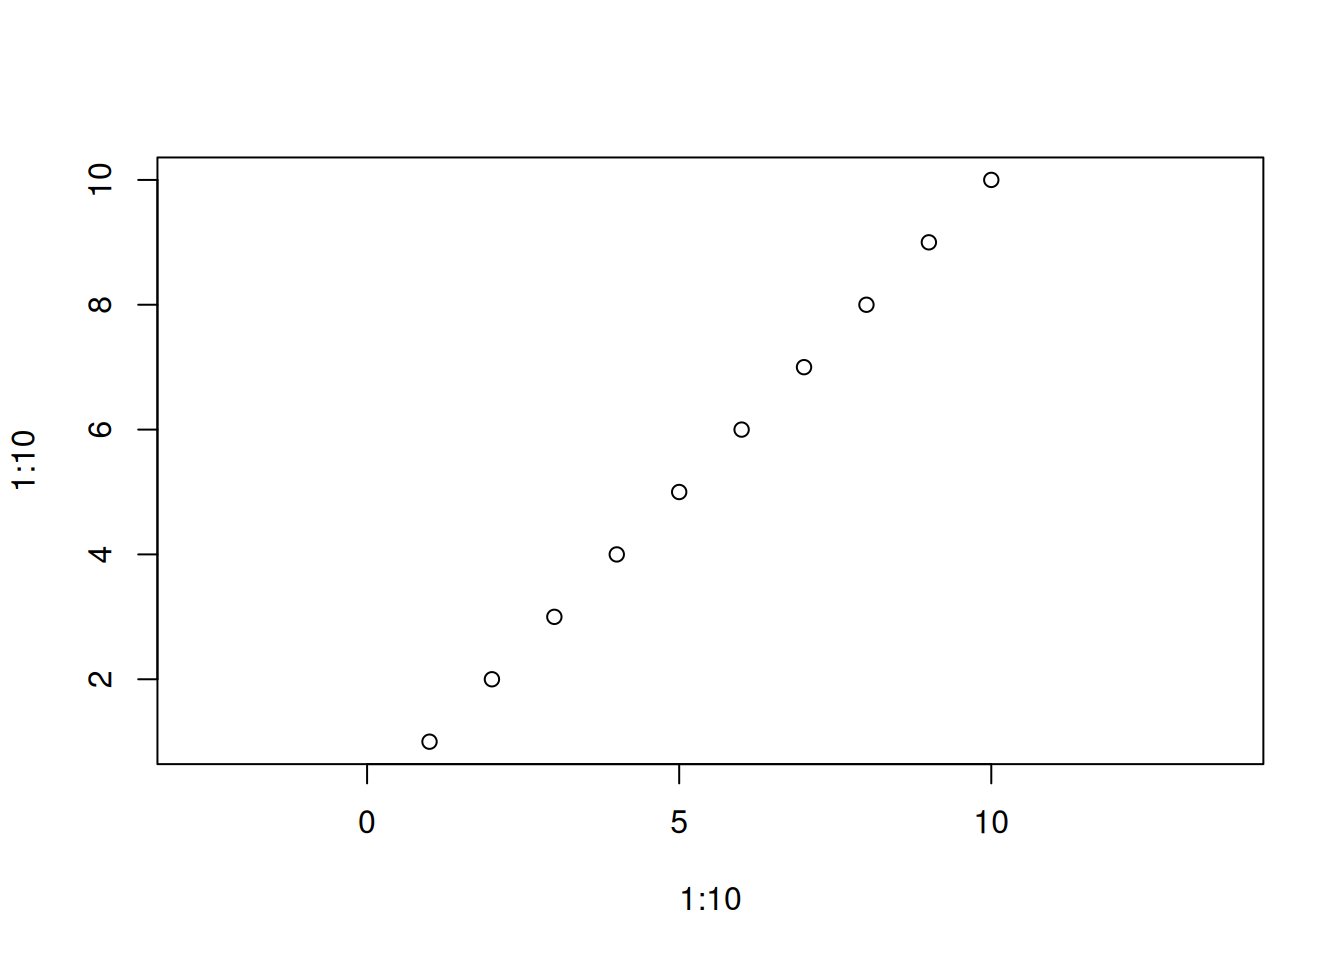
asp parameter.
Original Japanese version: Rのプロットのアスペクト比を設定する方法
In R plotting functions such as plot(), the aspect ratio can be set with the asp parameter. The aspect ratio specifies how many times the unit length of the y-axis is relative to the unit length of the x-axis.
asp ParameterYou can adjust the aspect ratio by specifying the asp parameter inside plot().
In the example above, asp = 1 is set, so the unit lengths of the x-axis and y-axis are equal. If asp = 2 is set, the unit length of the y-axis becomes twice that of the x-axis.
plot(1:10, 1:10, asp = 2)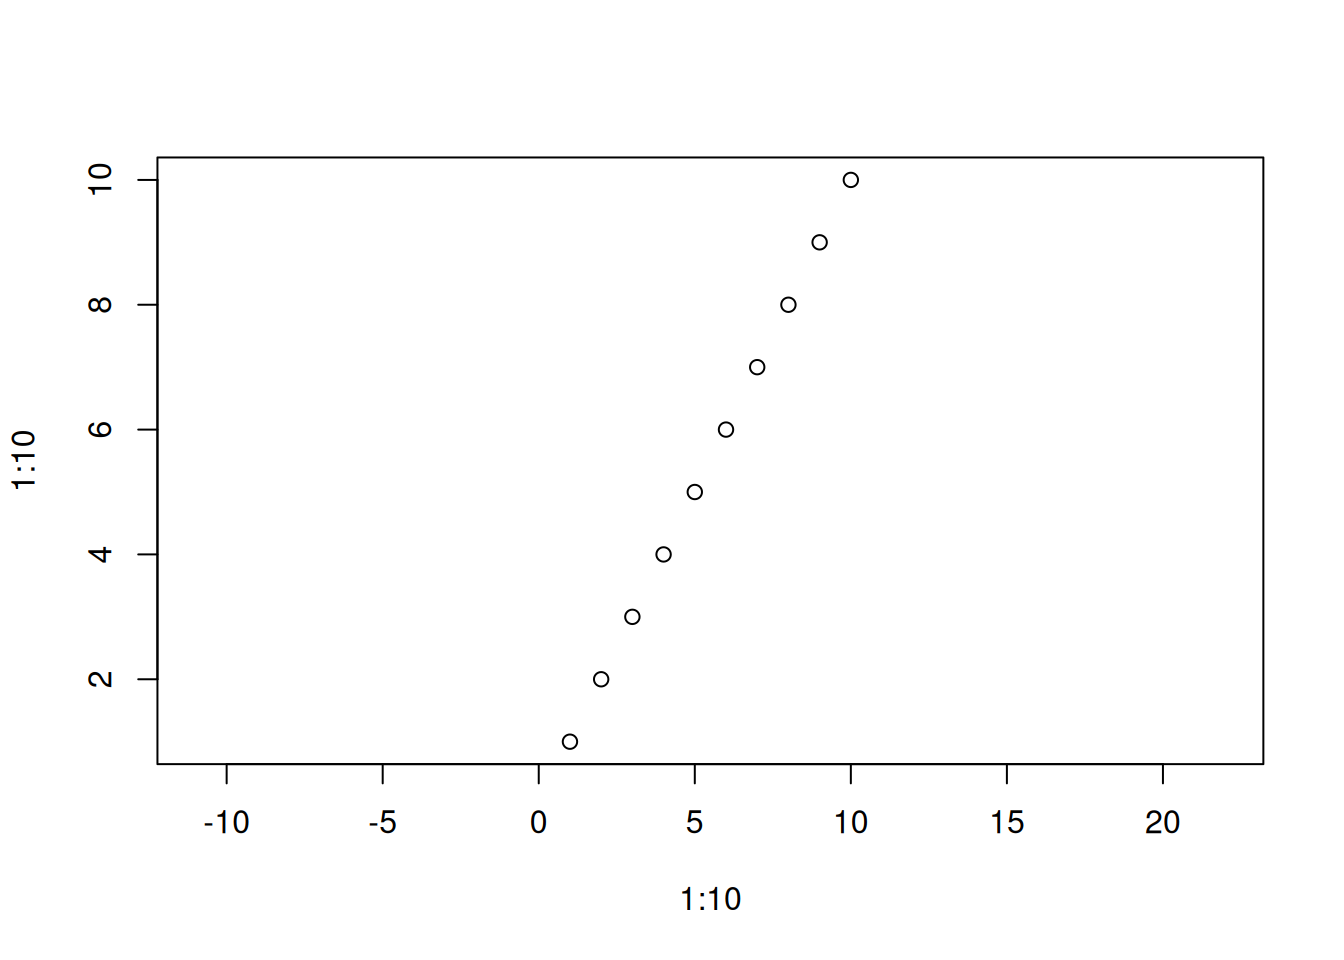
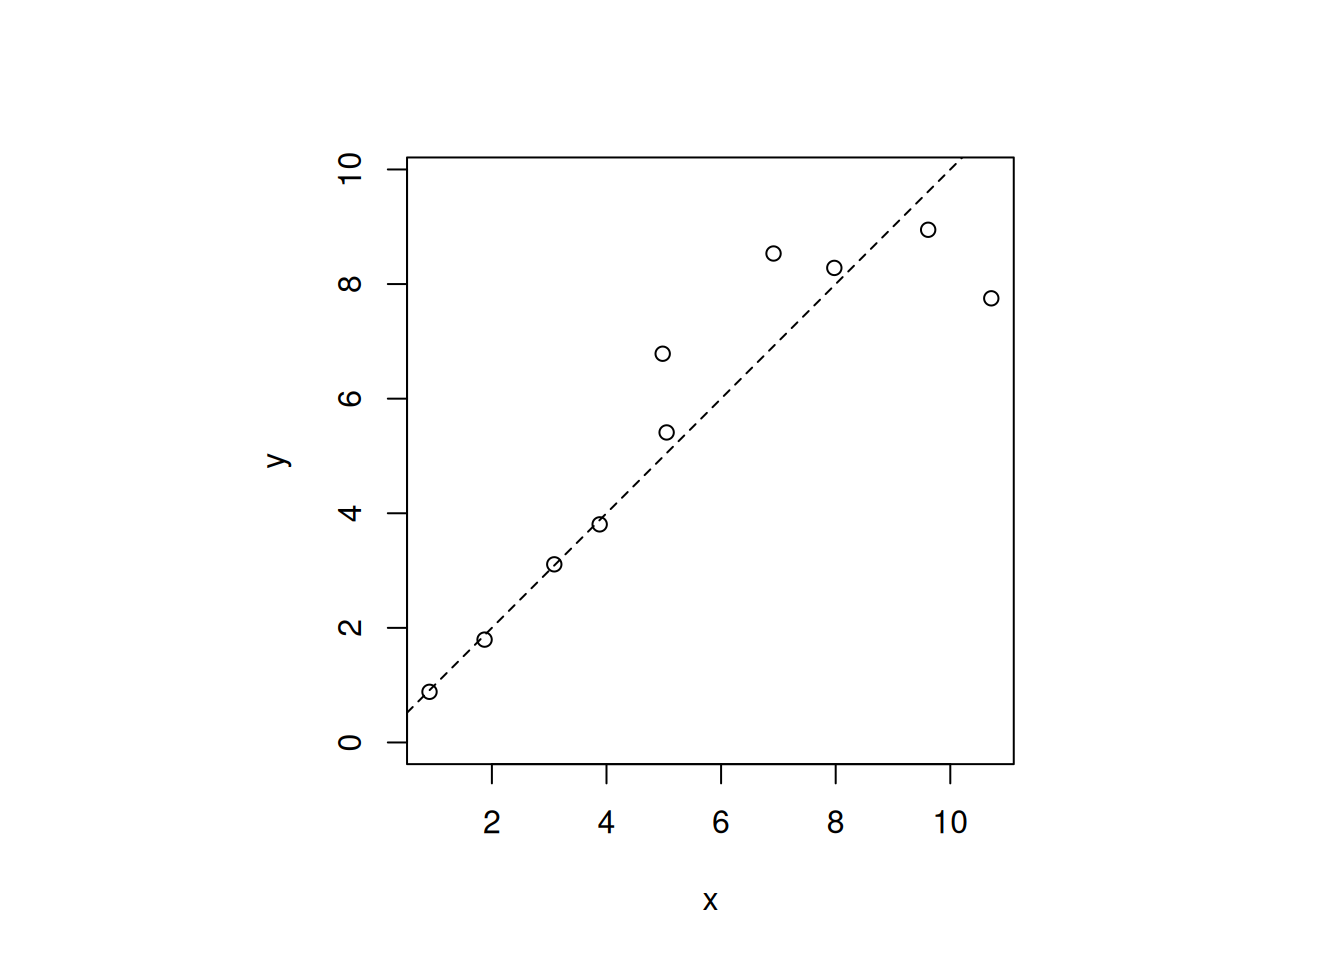
This is useful when making a 1:1 plot, such as when drawing a 1:1 line. Depending on the shape of the plot region, the actual display may not become square. In that case, you can also use par(pty = "s") to set the plot region to a square.
rnorm(): generates random numbers following a normal distribution. Here it generates random numbers with mean 1 and standard deviation 0.1.abline(0, 1, lty = 2): draws the line y = x as a dashed line. lty = 2 means a dashed line.